HTTP Baseline
We expect to easily overrun the 1Gb/s capacity on the NICs in this test so the following set up is required.
AWS instance type
AWS instance that supports 10G network c3.8xlarge dedicated tenancy Placement_group must be set in order for the network to function at > 1Gb/s
ixgbevf driver installed
For the Amazon linux image baseline image used ixgbevf is installed by default
[ec2-user@ip-172-31-3-150 ~]$ ethtool -i eth0
driver: ixgbevf
version: 2.14.2+amzn
firmware-version: N/A
bus-info: 0000:00:03.0
supports-statistics: yes
supports-test: yes
supports-eeprom-access: no
supports-register-dump: yes
supports-priv-flags: no
IRQ pinning
Set as root
sudo su -
Get the interrupts for the NIC TX/RX queues
  grep eth0-TxRx /proc/interrupts  | awk -F: '{print $1}'
  242
  243
this gives us the 2 TX/RX interrupts
Set CPU affinity of the IRQ interrupts to CPU0 and CPU16:
  echo 00000001 > /proc/irq/242/smp_affinity
  echo 00010000 > /proc/irq/243/smp_affinity
RPS configuration
- Set RPS for 7 CPUs for the 2 queues
  echo '000000fe' >/sys/class/net/eth0/queues/rx-0/rps_cpus
  echo '00fe0000' >/sys/class/net/eth0/queues/rx-1/rps_cpus
disable irqbalance
service irqbalance stop
Set the clock source to be tps
echo tsc > /sys/devices/system/clocksource/clocksource0/current_clocksource
Test Setup
The goal of this set if test is to examine the behaviour of the application in a simple HTTP processing scenario. In this case round-tripping a request for the root favicon.ico (318 bytes).
Although Rubris is not a traditional webserver in its focus, HTTP parsing and processing is the foundation of the HTTP long polling and connectivity functions, as well as the direct endpoint handling. Therefore, this test is a good foundation for the basic HTTP processing chain and how we expect it to scale. The test does not use pipelined requests as rubris-io does not support them (as most browsers do not).
The network throughput is included on the native results to illustrate the level of network usage at these TPS.
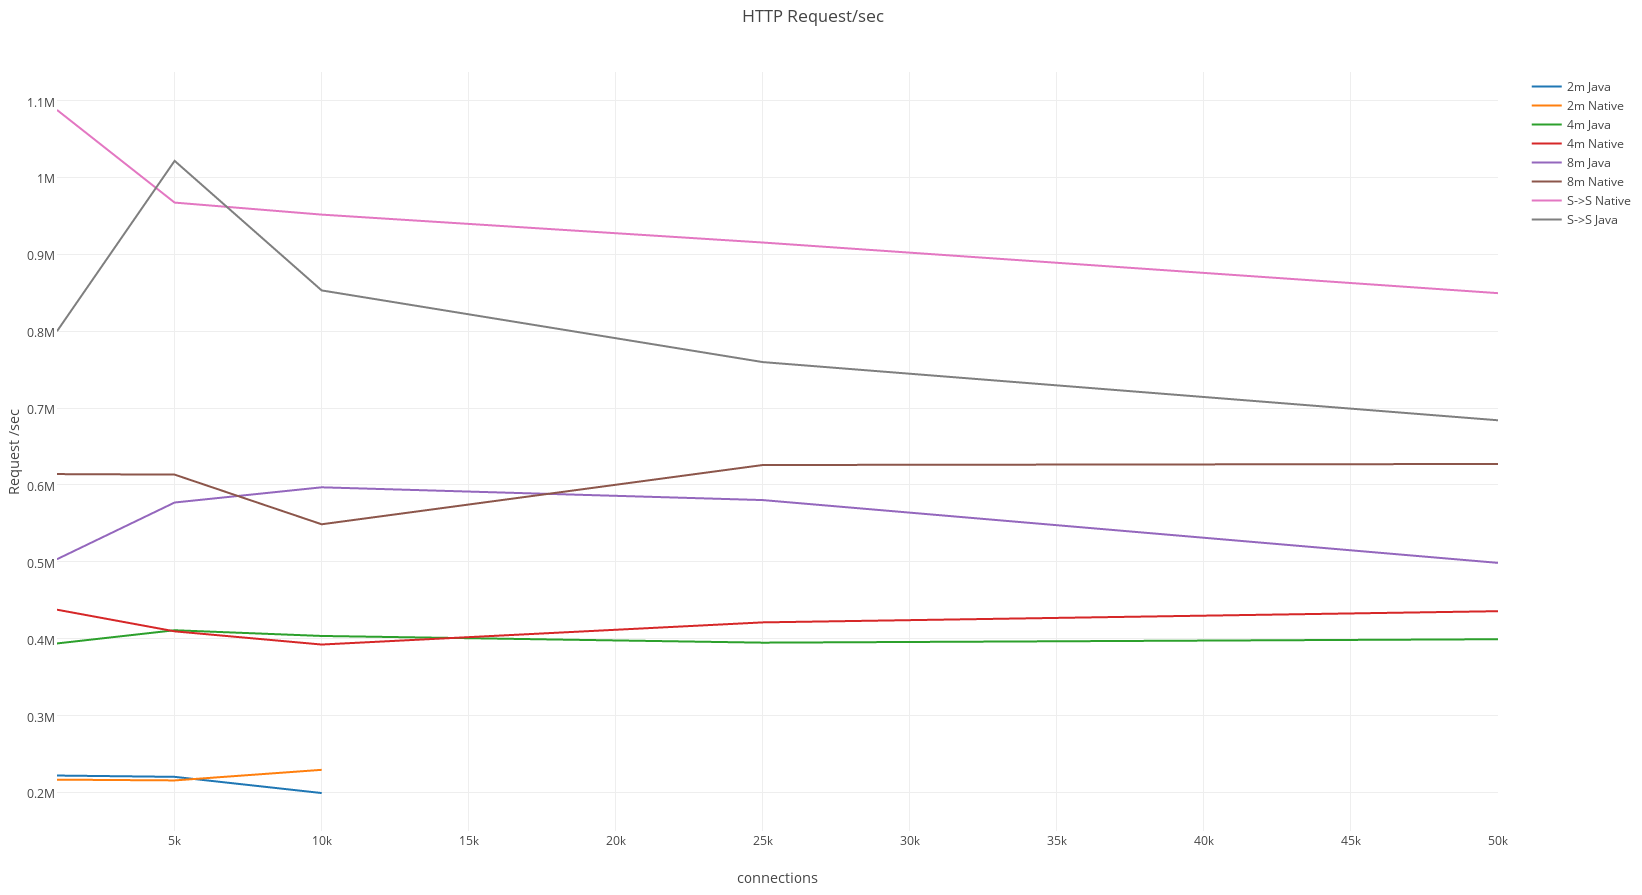
Server -> Server
Server 1
scp and untar rubris-io-0.2.4-SNAPSHOT-test-app.tar.gz
Then run as native sockets & multi-accept
./rubris/scripts/run 8091 login false 8 16384 true
Server 2
This will be the wrk server.
The initial set of tests run using the Native lib extensions, followed by the pure Java test at the same scale.
Native Library
./wrk/wrk -t20 -c1000 -d30s http://10.0.1.189:8091/favicon.ico
Running 30s test @ http://10.0.1.189:8091/favicon.ico
  20 threads and 1000 connections
  Thread Stats   Avg      Stdev     Max   +/- Stdev
    Latency     0.90ms  556.88us  47.24ms   94.66%
    Req/Sec    54.74k     7.76k  107.80k    87.47%
  32739172 requests in 30.10s, 17.59GB read
Requests/sec: 1087704.52
Transfer/sec:    598.53MB


./wrk/wrk -t20 -c2000 -d30s http://10.0.1.189:8091/favicon.ico
Running 30s test @ http://10.0.1.189:8091/favicon.ico
  20 threads and 2000 connections
  Thread Stats   Avg      Stdev     Max   +/- Stdev
    Latency     1.79ms    1.71ms 203.92ms   97.89%
    Req/Sec    55.18k     5.38k  181.75k    85.46%
  33006124 requests in 30.10s, 17.74GB read
Requests/sec: 1096550.14
Transfer/sec:    603.40MB

./wrk/wrk -t20 -c5000 -d30s http://10.0.1.189:8091/favicon.ico
Running 30s test @ http://10.0.1.189:8091/favicon.ico
  20 threads and 5000 connections
  Thread Stats   Avg      Stdev     Max   +/- Stdev
    Latency     8.47ms   23.97ms 834.41ms   97.36%
    Req/Sec    48.62k     3.76k   97.86k    77.79%
  29101865 requests in 30.09s, 15.64GB read
Requests/sec: 967206.75
Transfer/sec:    532.22MB

 ./wrk/wrk -t20 -c10000 -d30s http://10.0.1.189:8091/favicon.ico
Running 30s test @ http://10.0.1.189:8091/favicon.ico
  20 threads and 10000 connections
  Thread Stats   Avg      Stdev     Max   +/- Stdev
    Latency    13.46ms   22.67ms 652.26ms   96.45%
    Req/Sec    47.89k     8.16k   99.80k    65.36%
  28637776 requests in 30.10s, 15.39GB read
Requests/sec: 951576.99
Transfer/sec:    523.62MB

./wrk/wrk -t28 -c25000 -d30s http://10.0.1.189:8091/favicon.ico
Running 30s test @ http://10.0.1.189:8091/favicon.ico
  28 threads and 25000 connections
  Thread Stats   Avg      Stdev     Max   +/- Stdev
    Latency    34.82ms   50.32ms   1.78s    94.26%
    Req/Sec    33.13k     9.39k  134.67k    77.11%
  27553186 requests in 30.10s, 14.81GB read
  Socket errors: connect 0, read 0, write 0, timeout 13
Requests/sec: 915269.83
Transfer/sec:    503.65MB

./wrk/wrk -t28 -c50000 -d30s http://10.0.1.189:8091/favicon.ico
Running 30s test @ http://10.0.1.189:8091/favicon.ico
  28 threads and 50000 connections
  Thread Stats   Avg      Stdev     Max   +/- Stdev
    Latency    67.62ms   70.11ms   2.00s    93.35%
    Req/Sec    30.71k     6.47k   45.05k    71.84%
  25570822 requests in 30.10s, 13.74GB read
  Socket errors: connect 0, read 0, write 0, timeout 118
Requests/sec: 849399.95
Transfer/sec:    467.40MB
Network throughput
To give an idea of the network throughput, this is the network usage at 50,000 users (the peak is ~5Gb/s at 2k users).
2:37:37 eth0 DOWN:3 Kb/s   UP:3 Kb/s
12:37:38 eth0 DOWN:528 b/s   UP:1 Kb/s
12:37:39 eth0 DOWN:599 Mb/s   UP:196 Mb/s
12:37:40 eth0 DOWN:3925 Mb/s   UP:767 Mb/s
12:37:41 eth0 DOWN:4186 Mb/s   UP:809 Mb/s
12:37:42 eth0 DOWN:4238 Mb/s   UP:818 Mb/s
12:37:43 eth0 DOWN:4286 Mb/s   UP:844 Mb/s
12:37:44 eth0 DOWN:4373 Mb/s   UP:837 Mb/s
12:37:45 eth0 DOWN:4360 Mb/s   UP:836 Mb/s
12:37:46 eth0 DOWN:4329 Mb/s   UP:842 Mb/s
12:37:47 eth0 DOWN:4351 Mb/s   UP:845 Mb/s
12:37:48 eth0 DOWN:4356 Mb/s   UP:833 Mb/s
12:37:49 eth0 DOWN:4362 Mb/s   UP:837 Mb/s
12:37:50 eth0 DOWN:4345 Mb/s   UP:851 Mb/s
12:37:51 eth0 DOWN:4307 Mb/s   UP:841 Mb/s
12:37:52 eth0 DOWN:4306 Mb/s   UP:850 Mb/s
12:37:53 eth0 DOWN:4333 Mb/s   UP:839 Mb/s
12:37:54 eth0 DOWN:4400 Mb/s   UP:836 Mb/s
12:37:55 eth0 DOWN:4373 Mb/s   UP:835 Mb/s
12:37:56 eth0 DOWN:4437 Mb/s   UP:846 Mb/s
12:37:57 eth0 DOWN:4353 Mb/s   UP:840 Mb/s
12:37:58 eth0 DOWN:4352 Mb/s   UP:846 Mb/s
12:37:59 eth0 DOWN:4373 Mb/s   UP:840 Mb/s
12:38:00 eth0 DOWN:4399 Mb/s   UP:834 Mb/s
12:38:01 eth0 DOWN:4474 Mb/s   UP:834 Mb/s
12:38:02 eth0 DOWN:4290 Mb/s   UP:849 Mb/s
12:38:03 eth0 DOWN:4343 Mb/s   UP:845 Mb/s
12:38:04 eth0 DOWN:4374 Mb/s   UP:840 Mb/s
12:38:05 eth0 DOWN:4341 Mb/s   UP:850 Mb/s
12:38:06 eth0 DOWN:4390 Mb/s   UP:839 Mb/s
12:38:07 eth0 DOWN:4338 Mb/s   UP:847 Mb/s
12:38:08 eth0 DOWN:4357 Mb/s   UP:845 Mb/s
12:38:09 eth0 DOWN:4005 Mb/s   UP:758 Mb/s
12:38:10 eth0 DOWN:11 Mb/s   UP:25 Mb/s
Pure Java
The pure Java run is the server configured to run without the Native Library (relying instead on Java’s NIO functionality).
./wrk/wrk -t20 -c1000 -d30s http://10.0.1.189:8091/favicon.ico
Running 30s test @ http://10.0.1.189:8091/favicon.ico
  20 threads and 1000 connections
  Thread Stats   Avg      Stdev     Max   +/- Stdev
    Latency     1.67ms  595.04us   9.96ms   60.18%
    Req/Sec    29.73k     9.54k   72.12k    85.33%
  17806722 requests in 30.10s, 9.57GB read
Requests/sec: 591579.81
Transfer/sec:    325.53MB

./wrk/wrk -t20 -c2000 -d30s http://10.0.1.189:8091/favicon.ico
Running 30s test @ http://10.0.1.189:8091/favicon.ico
  20 threads and 2000 connections
  Thread Stats   Avg      Stdev     Max   +/- Stdev
    Latency     2.57ms    1.71ms  22.75ms   73.79%
    Req/Sec    40.25k    26.45k  127.24k    77.13%
  24076457 requests in 30.10s, 12.94GB read
Requests/sec: 799892.63
Transfer/sec:    440.16MB
~
./wrk/wrk -t20 -c5000 -d30s http://10.0.1.189:8091/favicon.ico
Running 30s test @ http://10.0.1.189:8091/favicon.ico
  20 threads and 5000 connections
  Thread Stats   Avg      Stdev     Max   +/- Stdev
    Latency     6.10ms   12.01ms 624.75ms   98.00%
    Req/Sec    51.41k    32.42k  151.72k    69.99%
  30733076 requests in 30.09s, 16.52GB read
Requests/sec: 1021495.63
Transfer/sec:    562.10MB

./wrk/wrk -t20 -c10000 -d30s http://10.0.1.189:8091/favicon.ico
Running 30s test @ http://10.0.1.189:8091/favicon.ico
  20 threads and 10000 connections
  Thread Stats   Avg      Stdev     Max   +/- Stdev
    Latency    16.98ms   18.94ms 409.43ms   80.27%
    Req/Sec    42.99k    48.18k  149.86k    81.11%
  25674803 requests in 30.10s, 13.80GB read
Requests/sec: 852955.12
Transfer/sec:    469.36MB

./wrk/wrk -t28 -c25000 -d30s http://10.0.1.189:8091/favicon.ico
Running 30s test @ http://10.0.1.189:8091/favicon.ico
  28 threads and 25000 connections
  Thread Stats   Avg      Stdev     Max   +/- Stdev
    Latency    51.64ms   90.68ms   1.98s    92.64%
    Req/Sec    27.32k    25.22k  145.42k    85.77%
  22865735 requests in 30.10s, 12.29GB read
  Socket errors: connect 0, read 0, write 0, timeout 181
Requests/sec: 759733.86
Transfer/sec:    418.06MB

 ./wrk/wrk -t28 -c50000 -d30s http://10.0.1.189:8091/favicon.ico
Running 30s test @ http://10.0.1.189:8091/favicon.ico
  28 threads and 50000 connections
  Thread Stats   Avg      Stdev     Max   +/- Stdev
    Latency    85.89ms   81.54ms   2.00s    90.71%
    Req/Sec    24.68k     6.38k  134.21k    81.62%
  20592121 requests in 30.10s, 11.07GB read
  Socket errors: connect 0, read 0, write 0, timeout 214
Requests/sec: 684051.42
Transfer/sec:    376.41MB
Localhost Behaviour
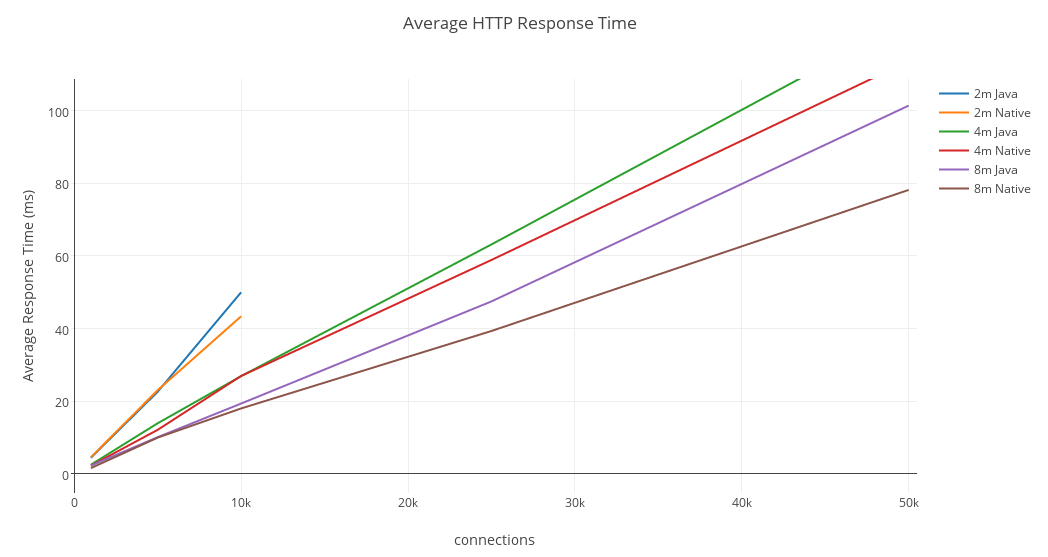
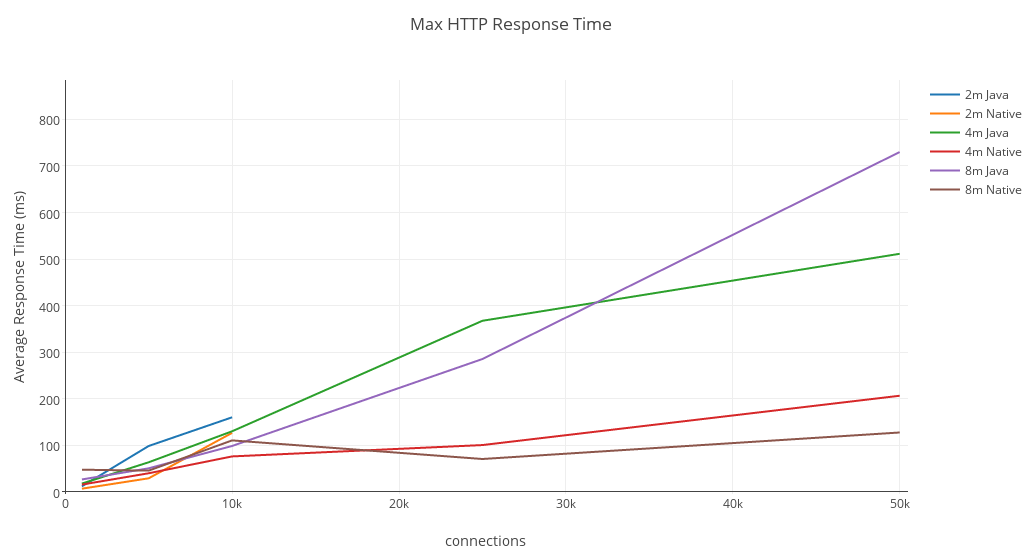
To examine the effect of the network we also ran different combinations of 2,4 and 8 modules to isolate the test from the networking overhead on min/max latencies as well as to demonstrate the effect that adding more modules has. Ideally, we should expect an almost linear increase as we add modules.
None of the tests were limited by measurable CPU contention.
As expected, the native modules showed a slight better average latency at nearly all user levels (especially the higher counts), a flatter max latency and a significantly better throughput (>10%)for module counts above 2.
However, on a day to day basis the differences are probably minimal for most applications.
2 modules
Pure Java
 ./wrk/wrk -t12 -c1000 -d30s http://127.0.0.1:8091/favicon.ico
Running 30s test @ http://127.0.0.1:8091/favicon.ico
  12 threads and 1000 connections
  Thread Stats   Avg      Stdev     Max   +/- Stdev
    Latency     4.47ms    1.85ms  11.29ms   61.64%
    Req/Sec    18.65k     2.96k   76.93k    70.87%
  6680660 requests in 30.10s, 3.59GB read
Requests/sec: 221956.80
Transfer/sec:    122.14MB


./wrk/wrk -t12 -c5000 -d30s http://127.0.0.1:8091/favicon.ico
Running 30s test @ http://127.0.0.1:8091/favicon.ico
  12 threads and 5000 connections
  Thread Stats   Avg      Stdev     Max   +/- Stdev
    Latency    22.62ms   17.79ms  97.93ms   56.57%
    Req/Sec    18.49k     4.10k   27.57k    61.78%
  6623273 requests in 30.07s, 3.56GB read
Requests/sec: 220251.60
Transfer/sec:    121.20MB


./wrk/wrk -t12 -c10000 -d30s http://127.0.0.1:8091/favicon.ico
Running 30s test @ http://127.0.0.1:8091/favicon.ico
  12 threads and 10000 connections
  Thread Stats   Avg      Stdev     Max   +/- Stdev
    Latency    50.00ms   26.07ms 159.66ms   53.79%
    Req/Sec    16.73k     1.68k   22.41k    67.19%
  5993336 requests in 30.09s, 3.22GB read
Requests/sec: 199175.64
Transfer/sec:    109.60MB
Native Library
./wrk/wrk -t12 -c1000 -d30s http://127.0.0.1:8091/favicon.ico
Running 30s test @ http://127.0.0.1:8091/favicon.ico
  12 threads and 1000 connections
  Thread Stats   Avg      Stdev     Max   +/- Stdev
    Latency     4.58ms  386.21us   6.20ms   69.81%
    Req/Sec    18.20k     0.97k   59.42k    98.78%
  6520371 requests in 30.10s, 3.50GB read
Requests/sec: 216623.77
Transfer/sec:    119.20MB

./wrk/wrk -t12 -c2000 -d30s http://127.0.0.1:8091/favicon.ico
Running 30s test @ http://127.0.0.1:8091/favicon.ico
  12 threads and 2000 connections
  Thread Stats   Avg      Stdev     Max   +/- Stdev
    Latency     8.37ms  314.12us  13.11ms   74.06%
    Req/Sec    19.92k   533.12    22.47k    80.58%
  7136957 requests in 30.03s, 3.84GB read
Requests/sec: 237649.39
Transfer/sec:    130.77MB

./wrk/wrk -t12 -c5000 -d30s http://127.0.0.1:8091/favicon.ico
Running 30s test @ http://127.0.0.1:8091/favicon.ico
  12 threads and 5000 connections
  Thread Stats   Avg      Stdev     Max   +/- Stdev
    Latency    23.06ms    1.02ms  28.51ms   91.22%
    Req/Sec    18.11k     1.07k   72.02k    92.44%
  6487462 requests in 30.09s, 3.49GB read
Requests/sec: 215601.29
Transfer/sec:    118.64MB

./wrk/wrk -t12 -c10000 -d30s http://127.0.0.1:8091/favicon.ico
Running 30s test @ http://127.0.0.1:8091/favicon.ico
  12 threads and 10000 connections
  Thread Stats   Avg      Stdev     Max   +/- Stdev
    Latency    43.39ms    2.39ms 126.28ms   92.84%
    Req/Sec    19.28k     1.44k   23.34k    70.96%
  6904356 requests in 30.10s, 3.71GB read
Requests/sec: 229391.22
Transfer/sec:    126.23MB
4 Modules
Pure java
./wrk/wrk -t12 -c1000 -d30s http://127.0.0.1:8091/favicon.ico
Running 30s test @ http://127.0.0.1:8091/favicon.ico
  12 threads and 1000 connections
  Thread Stats   Avg      Stdev     Max   +/- Stdev
    Latency     2.54ms    1.62ms  17.24ms   59.37%
    Req/Sec    33.08k    20.71k  117.55k    83.18%
  11852592 requests in 30.10s, 6.37GB read
Requests/sec: 393777.43
Transfer/sec:    216.68MB

./wrk/wrk -t12 -c2000 -d30s http://127.0.0.1:8091/favicon.ico
Running 30s test @ http://127.0.0.1:8091/favicon.ico
  12 threads and 2000 connections
  Thread Stats   Avg      Stdev     Max   +/- Stdev
    Latency     4.82ms    2.90ms  61.76ms   73.43%
    Req/Sec    34.76k    10.34k   53.38k    50.25%
  12449314 requests in 30.02s, 6.69GB read
Requests/sec: 414704.47
Transfer/sec:    228.20MB

./wrk/wrk -t12 -c5000 -d30s http://127.0.0.1:8091/favicon.ico
Running 30s test @ http://127.0.0.1:8091/favicon.ico
  12 threads and 5000 connections
  Thread Stats   Avg      Stdev     Max   +/- Stdev
    Latency    13.95ms   11.81ms  62.96ms   71.03%
    Req/Sec    34.50k     8.16k   46.69k    60.14%
  12355916 requests in 30.07s, 6.64GB read
Requests/sec: 410940.80
Transfer/sec:    226.13MB

 ./wrk/wrk -t12 -c10000 -d30s http://127.0.0.1:8091/favicon.ico
Running 30s test @ http://127.0.0.1:8091/favicon.ico
  12 threads and 10000 connections
  Thread Stats   Avg      Stdev     Max   +/- Stdev
    Latency    26.92ms   20.24ms 129.63ms   57.41%
    Req/Sec    33.90k     6.27k   45.70k    60.83%
  12142670 requests in 30.09s, 6.53GB read
Requests/sec: 403509.84
Transfer/sec:    222.04MB

 ./wrk/wrk -t12 -c25000 -d30s http://127.0.0.1:8091/favicon.ico
Running 30s test @ http://127.0.0.1:8091/favicon.ico
  12 threads and 25000 connections
  Thread Stats   Avg      Stdev     Max   +/- Stdev
    Latency    63.17ms   29.37ms 367.95ms   70.94%
    Req/Sec    33.23k     2.24k   43.46k    71.99%
  11862980 requests in 30.05s, 6.37GB read
Requests/sec: 394796.07
Transfer/sec:    217.24MB

 ./wrk/wrk -t12 -c50000 -d30s http://127.0.0.1:8091/favicon.ico
Running 30s test @ http://127.0.0.1:8091/favicon.ico
  12 threads and 50000 connections
  Thread Stats   Avg      Stdev     Max   +/- Stdev
    Latency   124.29ms   30.14ms 511.29ms   73.69%
    Req/Sec    33.66k     2.62k   43.69k    70.93%
  12015726 requests in 30.09s, 6.46GB read
Requests/sec: 399272.16
Transfer/sec:    219.71MB
Native Library
./wrk/wrk -t12 -c1000 -d30s http://127.0.0.1:8091/favicon.ico
Running 30s test @ http://127.0.0.1:8091/favicon.ico
  12 threads and 1000 connections
  Thread Stats   Avg      Stdev     Max   +/- Stdev
    Latency     2.27ms  602.69us  60.48ms   99.23%
    Req/Sec    36.77k     2.21k   81.75k    98.58%
  13173786 requests in 30.10s, 7.08GB read
Requests/sec: 437678.01
Transfer/sec:    240.84MB

 ./wrk/wrk -t12 -c2000 -d30s http://127.0.0.1:8091/favicon.ico
Running 30s test @ http://127.0.0.1:8091/favicon.ico
  12 threads and 2000 connections
  Thread Stats   Avg      Stdev     Max   +/- Stdev
    Latency     4.57ms  515.45us  66.96ms   98.73%
    Req/Sec    36.49k     0.94k   38.67k    81.14%
  13066391 requests in 30.02s, 7.02GB read
Requests/sec: 435203.59
Transfer/sec:    239.48MB

 ./wrk/wrk -t12 -c5000 -d30s http://127.0.0.1:8091/favicon.ico
Running 30s test @ http://127.0.0.1:8091/favicon.ico
  12 threads and 5000 connections
  Thread Stats   Avg      Stdev     Max   +/- Stdev
    Latency    12.14ms    0.95ms  39.36ms   97.59%
    Req/Sec    34.40k     1.15k   58.22k    82.67%
  12320075 requests in 30.08s, 6.62GB read
Requests/sec: 409517.22
Transfer/sec:    225.35MB

 ./wrk/wrk -t16 -c10000 -d30s http://127.0.0.1:8091/favicon.ico
Running 30s test @ http://127.0.0.1:8091/favicon.ico
  16 threads and 10000 connections
  Thread Stats   Avg      Stdev     Max   +/- Stdev
    Latency    26.97ms    1.88ms  75.56ms   93.52%
    Req/Sec    23.26k     2.21k   94.93k    98.75%
  11086930 requests in 30.10s, 5.96GB read
Requests/sec: 368318.23
Transfer/sec:    202.67MB

 ./wrk/wrk -t12 -c10000 -d30s http://127.0.0.1:8091/favicon.ico
Running 30s test @ http://127.0.0.1:8091/favicon.ico
  12 threads and 10000 connections
  Thread Stats   Avg      Stdev     Max   +/- Stdev
    Latency    25.38ms    1.14ms  41.62ms   83.13%
    Req/Sec    32.95k   846.67    35.12k    78.94%
  11802498 requests in 30.08s, 6.34GB read
Requests/sec: 392347.95
Transfer/sec:    215.90MB

 ./wrk/wrk -t12 -c25000 -d30s http://127.0.0.1:8091/favicon.ico
Running 30s test @ http://127.0.0.1:8091/favicon.ico
  12 threads and 25000 connections
  Thread Stats   Avg      Stdev     Max   +/- Stdev
    Latency    58.90ms    5.35ms  99.87ms   93.33%
    Req/Sec    35.49k     2.08k   61.84k    78.20%
  12680458 requests in 30.11s, 6.81GB read
Requests/sec: 421177.21
Transfer/sec:    231.76MB

./wrk/wrk -t12 -c50000 -d30s http://127.0.0.1:8091/favicon.ico
Running 30s test @ http://127.0.0.1:8091/favicon.ico
  12 threads and 50000 connections
  Thread Stats   Avg      Stdev     Max   +/- Stdev
    Latency   113.64ms    9.05ms 206.90ms   89.98%
    Req/Sec    36.74k     2.24k   41.12k    80.43%
  13114006 requests in 30.10s, 7.05GB read
Requests/sec: 435725.83
Transfer/sec:    239.77MB
8 Modules
Pure Java
./wrk/wrk -t20 -c1000 -d30s http://127.0.0.1:8091/favicon.ico
Running 30s test @ http://127.0.0.1:8091/favicon.ico
  20 threads and 1000 connections
  Thread Stats   Avg      Stdev     Max   +/- Stdev
    Latency     2.33ms    2.01ms  26.21ms   63.46%
    Req/Sec    25.34k    18.60k  105.31k    84.39%
  15150324 requests in 30.10s, 8.14GB read
Requests/sec: 503352.51
Transfer/sec:    276.98MB

./wrk/wrk -t20 -c2000 -d30s http://127.0.0.1:8091/favicon.ico
Running 30s test @ http://127.0.0.1:8091/favicon.ico
  20 threads and 2000 connections
  Thread Stats   Avg      Stdev     Max   +/- Stdev
    Latency     4.26ms    3.74ms  28.38ms   64.15%
    Req/Sec    27.28k    25.96k  129.54k    84.95%
  16308453 requests in 30.10s, 8.76GB read
Requests/sec: 541823.96
Transfer/sec:    298.15MB

./wrk/wrk -t20 -c5000 -d30s http://127.0.0.1:8091/favicon.ico
Running 30s test @ http://127.0.0.1:8091/favicon.ico
  20 threads and 5000 connections
  Thread Stats   Avg      Stdev     Max   +/- Stdev
    Latency    10.12ms    9.21ms  50.20ms   68.42%
    Req/Sec    29.11k    23.66k  114.51k    83.54%
  17370114 requests in 30.10s, 9.33GB read
Requests/sec: 577087.02
Transfer/sec:    317.55MB

./wrk/wrk -t20 -c10000 -d30s http://127.0.0.1:8091/favicon.ico
Running 30s test @ http://127.0.0.1:8091/favicon.ico
  20 threads and 10000 connections
  Thread Stats   Avg      Stdev     Max   +/- Stdev
    Latency    19.38ms   17.79ms  98.17ms   63.62%
    Req/Sec    30.11k    22.40k   93.05k    79.80%
  17946035 requests in 30.07s, 9.64GB read
Requests/sec: 596862.03
Transfer/sec:    328.44MB

./wrk/wrk -t20 -c25000 -d30s http://127.0.0.1:8091/favicon.ico
Running 30s test @ http://127.0.0.1:8091/favicon.ico
  20 threads and 25000 connections
  Thread Stats   Avg      Stdev     Max   +/- Stdev
    Latency    47.49ms   40.58ms 285.56ms   53.50%
    Req/Sec    29.28k    20.47k   91.97k    81.03%
  17465358 requests in 30.10s, 9.39GB read
Requests/sec: 580249.52
Transfer/sec:    319.29MB

./wrk/wrk -t20 -c50000 -d30s http://127.0.0.1:8091/favicon.ico
Running 30s test @ http://127.0.0.1:8091/favicon.ico
  20 threads and 50000 connections
  Thread Stats   Avg      Stdev     Max   +/- Stdev
    Latency   101.39ms   46.29ms 730.61ms   85.48%
    Req/Sec    25.23k     8.84k   63.68k    88.34%
  15008409 requests in 30.10s, 8.07GB read
Requests/sec: 498573.40
Transfer/sec:    274.35MB
Native Library
 ./wrk/wrk -t16 -c1000 -d30s http://127.0.0.1:8091/favicon.ico
Running 30s test @ http://127.0.0.1:8091/favicon.ico
  16 threads and 1000 connections
  Thread Stats   Avg      Stdev     Max   +/- Stdev
    Latency     1.61ms  561.60us  47.22ms   93.80%
    Req/Sec    38.62k     3.40k   89.89k    88.02%
  18483966 requests in 30.10s, 9.93GB read
Requests/sec: 614059.32
Transfer/sec:    337.90MB


./wrk/wrk -t20 -c2000 -d30s http://127.0.0.1:8091/favicon.ico
Running 30s test @ http://127.0.0.1:8091/favicon.ico
  20 threads and 2000 connections
  Thread Stats   Avg      Stdev     Max   +/- Stdev
    Latency     3.22ms  517.98us  27.67ms   87.97%
    Req/Sec    30.85k     2.23k   86.14k    92.27%
  18460155 requests in 30.10s, 9.92GB read
Requests/sec: 613363.43
Transfer/sec:    337.52MB

./wrk/wrk -t20 -c10000 -d30s http://127.0.0.1:8091/favicon.ico
Running 30s test @ http://127.0.0.1:8091/favicon.ico
  20 threads and 10000 connections
  Thread Stats   Avg      Stdev     Max   +/- Stdev
    Latency    18.03ms    2.01ms 110.03ms   83.24%
    Req/Sec    27.69k     1.90k   93.06k    94.23%
  16516471 requests in 30.10s, 8.88GB read
Requests/sec: 548771.73
Transfer/sec:    301.97MB

./wrk/wrk -t20 -c25000 -d30s http://127.0.0.1:8091/favicon.ico
Running 30s test @ http://127.0.0.1:8091/favicon.ico
  20 threads and 25000 connections
  Thread Stats   Avg      Stdev     Max   +/- Stdev
    Latency    39.35ms    2.75ms  70.33ms   79.44%
    Req/Sec    31.60k     1.89k   58.81k    71.14%
  18836146 requests in 30.10s, 10.12GB read
Requests/sec: 625869.29
Transfer/sec:    344.40MB

 ./wrk/wrk -t20 -c50000 -d30s http://127.0.0.1:8091/favicon.ico
Running 30s test @ http://127.0.0.1:8091/favicon.ico
  20 threads and 50000 connections
  Thread Stats   Avg      Stdev     Max   +/- Stdev
    Latency    78.18ms    5.12ms 127.07ms   78.11%
    Req/Sec    31.72k     2.30k   43.38k    70.61%
  18879409 requests in 30.10s, 10.15GB read
Requests/sec: 627211.18
Transfer/sec:    345.14MB
EC2 networking
One important point that came out of the testing is that the definition of low, medium and high networking in AWS seems to be intentionally vague.
From the testing it appeared that the xlarge machines are restricted to about 25% of the network card, x2large and x4large limited to about 500Mb (50% of the card). Only the x8large appeared to allow full usage. This interestingly enough manifested itself with multiple streams rather than single, so some other factor in the network may be at play, although we cannot confirm this.
The tcp dump data below was captured on the x4 large and showed significant redelivery and dropped packet issues (a similar pattern was observed on all sizes - but slightly less of an issue on the x8).
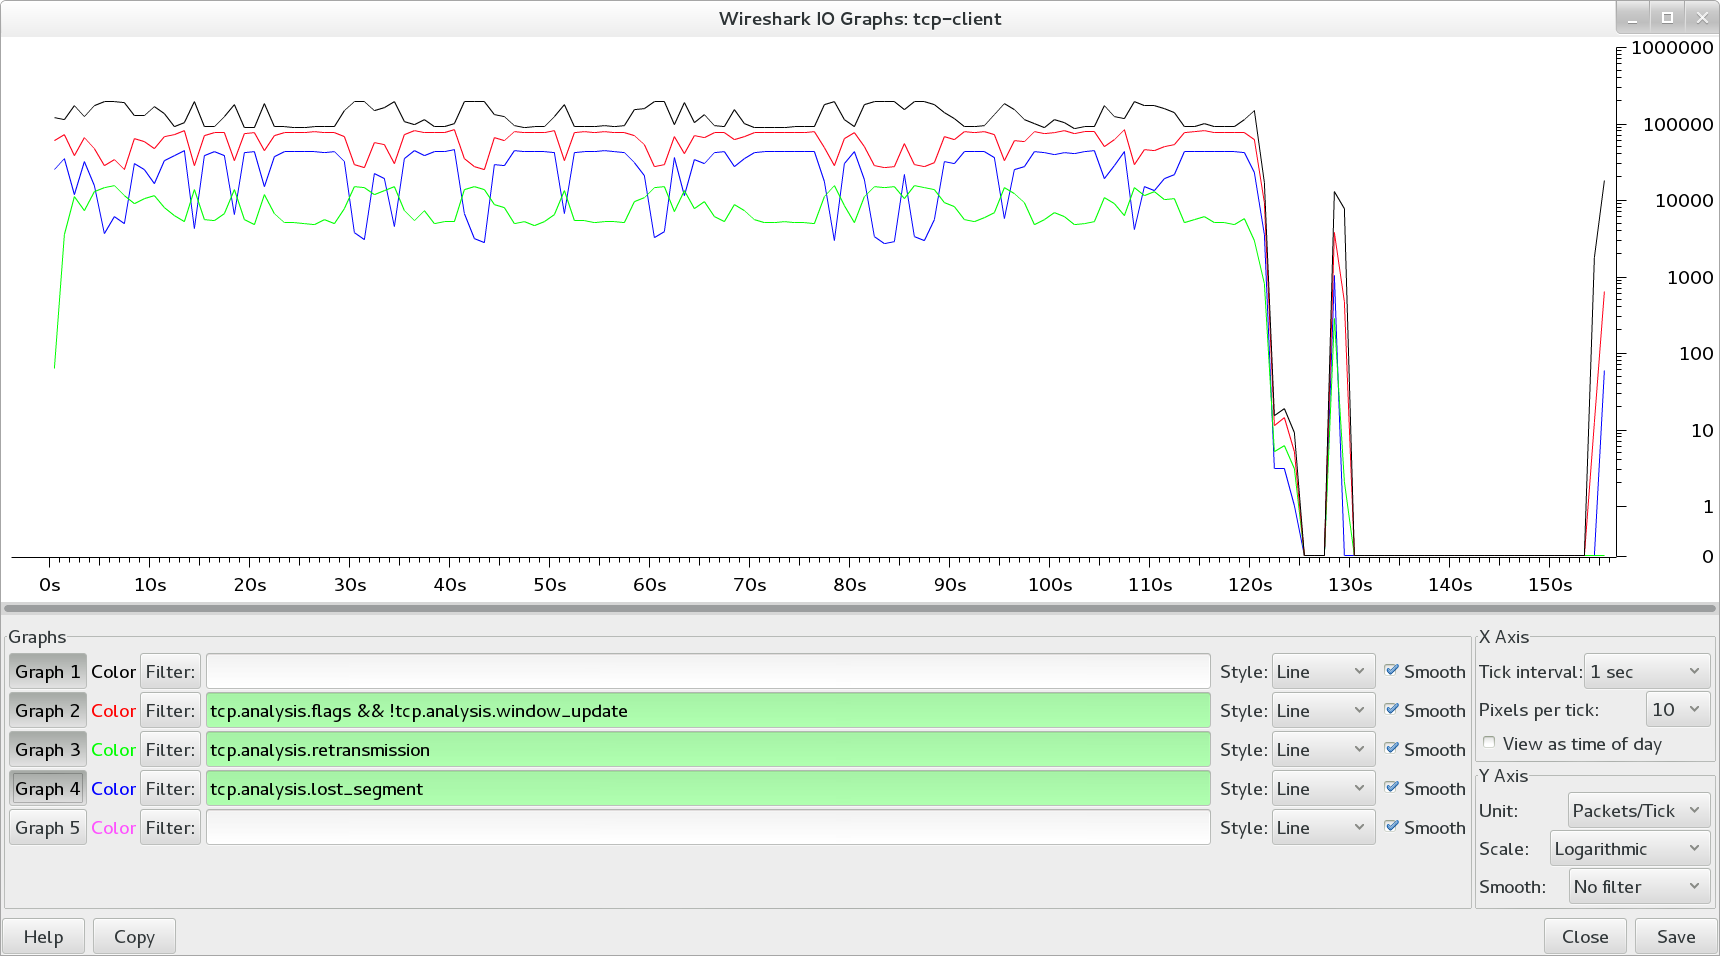 Click on the image to enlarge